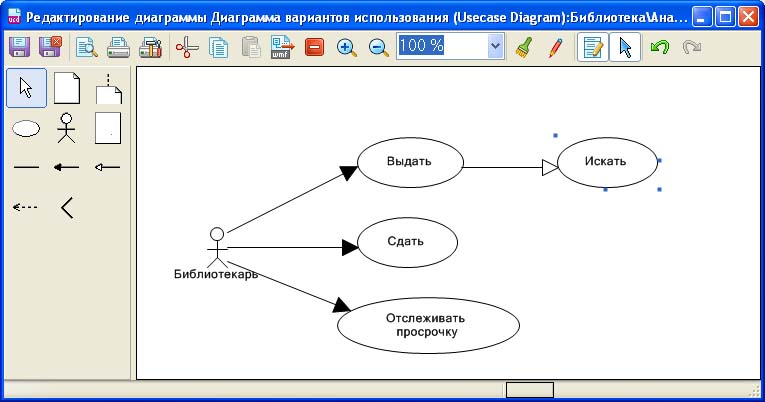
This article describes the features and capabilities for creating and editing items in the chart. Question work with diagrams with repository objects analyzed in article “Working with diagrams in the repository browser”.
Types of editable UML diagrams
- Chart of activities (Activity diagram)
- Class diagram (Class diagram)
- Collaboration diagram (Collaboration diagram)
- Deployment diagram (Deployment diagram)
- Sequence diagram (Sequence diagram)
- State diagram (Statechart diagram)
- Diagram of use cases (UseCase diagram)
The interface of the diagram editor
The window of the diagram editor contains the following areas:
- Chart area. Designed for placement of chart elements.
- Toolbar. Contains buttons for performing operations on the graph and its contents.
- Toolbox. Contains a list of items that can be displayed on the chart.
- Status. Contains service information and user prompts.
Between the panel and the drawing area is a tab. When moving the separator with the mouse to change the size of the Toolbox that allows you to conveniently place the elements. In the status bar is an indicator showing the background color and font color that are given to new elements.
The purpose of the toolbar buttons
| The name of the button | Description |
|---|---|
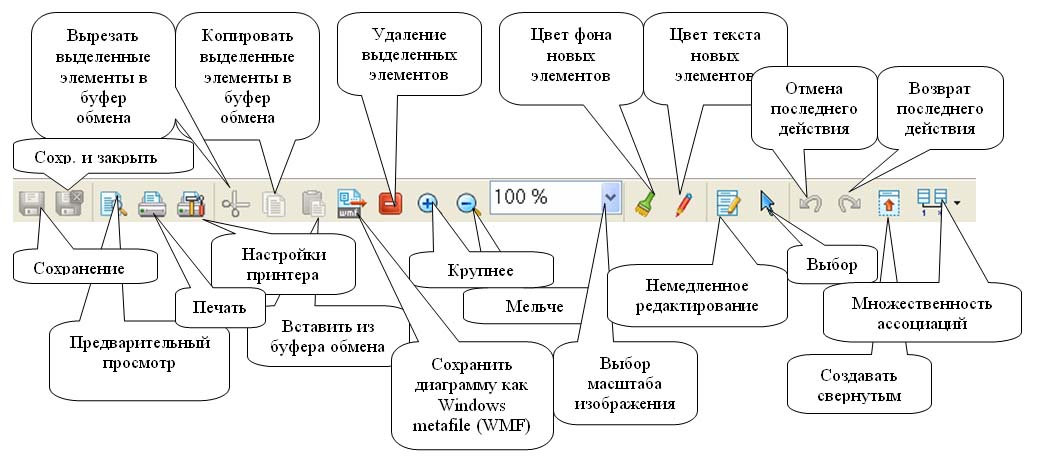
| Save | Save the chart. |
| Preview | Open a preview window before printing. |
| output the chart to the printer. | |
| Printer settings | Discovery settings dialog box the printer properties. |
| Cut the selected objects | Similar to copy objects, only the selected elements are removed from the graph. |
| Copy the selected objects | Highlighted in the chart items copied to the clipboard Windows. The copied elements can be inserted as in Flexberry Designer another similar figure, and in any other application (e.g., a text or graphics editor) in Windows metafile (WMF). |
| Paste from clipboard | Paste previously copied to the clipboard, the items on the chart. |
| Save the graph as a Windows metafile (WMF) | Allows you to save the graph as a vector image, it is possible to export the graph in wmf format as system-level and stage level. |
| Delete selected elements | Highlighted on the chart objects are deleted. |
| Larger | the zoom of the chart. |
| Smaller | decrease the scale of the chart image. |
| Choose scale image | Choice of the relative scale of the chart image. |
| The background color of the new elements | Change the background color of all new elements. For this purpose the existing graph objects their color do not change. The selected color is displayed in the status bar. |
| The text color of new items | change the color of text and lines all new elements, similar to the color of the background. |
| Create collapsed | Convenient that some of the diagram elements can appear collapsed. For example, the collapsed class on the class diagram becomes a rectangle with the class name. In this case, the attributes and methods of a class, of course, will not disappear, they just are not displayed. In General, it does not contradict the notation. So, if you enable this switch the new elements in the diagram will be created collapsed. |
| Immediate edit | If you enable this switch, after creating a new object in the diagram, it automatically switches to the edit mode of the name of the item. |
| Choose (cancel multiple object creation) | If you enable this switch after creating a new object in the diagram, the mouse cursor returns to normal selection mode. When the switch is memorization selected in the Toolbox, element type, and each subsequent mouse click in the chart area causes the creation of a new item of the same type. |
| Undoing the last action | Cancel the last action to edit the chart. |
| Redo the last action | Return the last canceled action. |
The manipulation of the elements on the diagram
Mainly, the elements of the diagrams are divided into two types:
- relations (associations, connectors reviews, etc.)
- “non-communication” (classes, actors, etc.)
To create a new item-“non-communication” you need:
- mouse to select the desired item type in the panel
- click on a blank spot in the chart area.
To create a new element of communication required:
- mouse to select the desired item type
- select the initial item available “non-communication”
- then (if necessary) click an arbitrary number of times in the empty places in the chart (to give context, the desired bending)
- choose the final item available.
Selection of an item in the chart is made click.
Re-click in the relevant part of the object allows you to edit the name or other properties of the object.
To select multiple objects, you need to hold down Shift. You can also select elements in a rectangular region. To do this, click the left mouse button above the chart, where there are no items and drag the mouse while pressing, describing the selection.
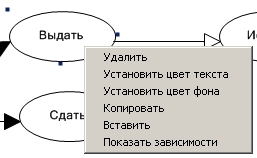
In General, the behavior of the elements, manipulating them depends on the particular type of item. Also depending on the type of element available and the context menu that appears when clicking right mouse button on the element.
The behavior of “not-connected” when you select
When you highlight the item appear four markers. They allow you to move the object, change its dimensions in the horizontal, vertical and both directions simultaneously. The user can also move the object not the marker, but directly pointing to its internal area.
The behavior of relations in the allocation
In the General case, the relationship is represented as a polyline, the ends of which are attached to the items “non-relations”.
If the user clicks on any segment of the polyline, select the connection entirely: the ends and every angle are tokenized. Pulling on the end markers, the user can “precipite” the end to any other available element. Pulling either handle angle, the user moves all of the corners connected.
If the user clicks the mouse on the corner, a bullet appears this angle and the user can move the angle “pulling” for this marker.
To create a new angle, the user can select a tool from the toolbar, then click on the desired segment. The same can be done simply by clicking the mouse on the segment, hold down on the keyboard Ctrl. The same can be done from the context menu.
To delete a corner, click on it, hold down on the keyboard Alt or from the context menu.
To create a new angle, the user can select the tool  from the toolbar, then click on the desired segment. The same can be done simply by clicking the mouse on the segment, hold down on the keyboard
 Ctrl. The same can be done from the context menu.
To delete a corner, click on it, hold down on the keyboard Alt or from the context menu.
Common context menu for all items
| The menu item | Short description |
|---|---|
| Delete | Delete the element from the diagram. |
| Set text color | Set the text color for selected items (created by the palette of colors is stored in the stage). |
| Set background colour | Set the background color for the selected elements (created by the palette of colors is stored in the stage). |
| Copy | Similar to the copy button on the toolbar. |
| Insert | Similarly, the paste button on the toolbar. |
| Show dependencies | Shows on any other charts in this stage is to use the item. |
Align class width
In order to equalize the classes (rectangular, or any other entity) to the width you need:
- Allocate the necessary objects.
- In the context menu, select “justify by width”.
All selected objects will be set the same width, equal to the maximum width of the selected objects.
Pessimistic locking of repository objects
Flexberry Designer is intended primarily for project teams, not individual developers. To ensure joint work on a UML model in the diagram editor provides a mechanism pessimistic locking. This means that if one team member begins work on any repository object (stage, diagram, class, relationship), others that this same item is available only for viewing. As soon as the first user finishes editing a repository object is available for editing by other users. If the repository object was not closed properly (power failure or other problem), then unlocking is as simple as re-running Flexberry Designer. If the class is open for editing by another user, by whom it was blocked you can see in the status bar (lower left corner of the window, under the chart).