Brief theoretical information
In UML notation an interaction of elements is considered in the information aspect of communication. In other words, the interacting objects exchange some information. This information is a complete message.
To describe the interaction of objects involved in a precedent use scripts. Сценарий is an instance of precedent that defines one of the possible flows of events of a given precedent. The precedent itself is an interweaving of scenarios – as the main, represent the normal course of events, and support defining the logic of the functioning of the system in situations of the form «what happens if…». In the early stages of system design, usually limited to a review of the basic scenario for each identified use case.
For example, the implementation of the precedent Оформление заказа:

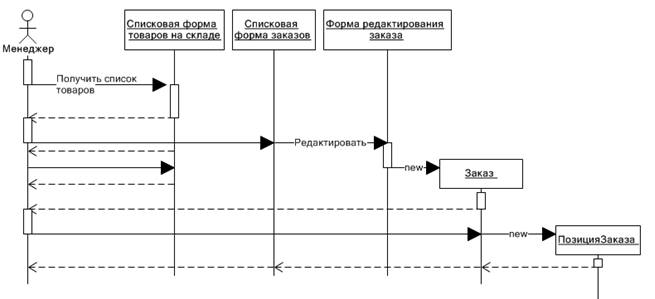
For this implementation you should build sequence diagram, which will describe сценарий the new заказа.
build Order charts of the sequences (Sequence Diagram)
- To create a sequence diagram. For example, the «creation of a new order».
- This diagram should reflect the interaction of objects classes. For example, «Manager», and «form a List of items in the warehouse», and «List form orders», and «Form edit orders», and «Ordering», and «Position Orders». The diagram shown in figure:

- To save the graph.
Sequence diagrams not only show the interaction of objects, but also allow us to determine/to find operations that needs to have certain classes.
Brief theoretical information about the chart of cooperation
Collaboration diagram is an alternative way of describing the interaction of objects and focuses primarily on the organization of the objects. Messages between objects are denoted by arrows, however, their temporal sequence is determined by the numbered arrows.
To create an implementation of «precedent invoiced» is to build a diagram of cooperation for the script «Print invoice».

build Order charts of the cooperation (Collaboration Diagram)
- Create a chart of cooperation
- Place the following elements:

3.To save the graph.